A-Level Maths - Statistics 1
Box and Whiskers Diagrams | A Level Maths Revision Notes
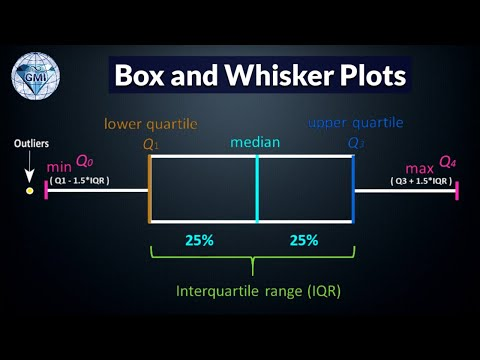
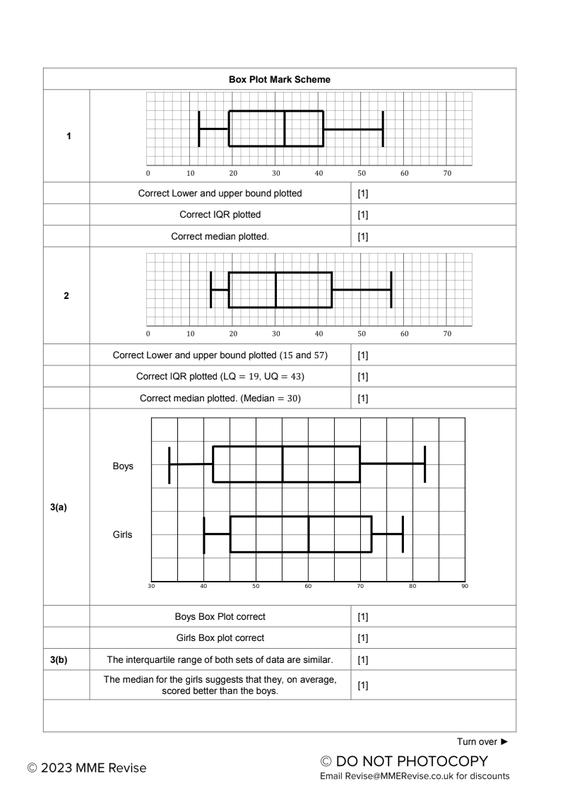
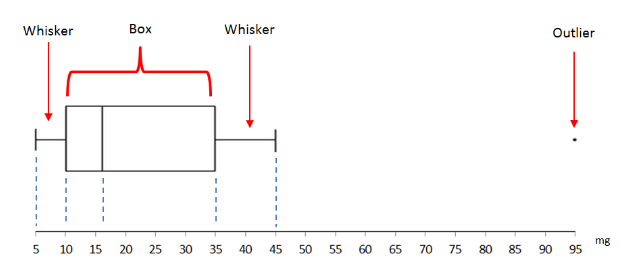
Summary A box and whiskers diagram displays a summary of a set of data. Maximum, Minimum, First Quartile, Third Quartile and Median, interquartile, upper limit, lower limit. Outlier can be present in the measurement, they thus need to be shown separately on the box and whiskers diagram. A box and whiskers diagram A box and ... Read more
Original link
Box and Whisker Plots Explained | Understanding Box and Whisker Plots (Box Plots) | Math with Mr. J
Original link
1) Quartile for ungrouped data
Original link
B3 Quartiles Worksheet Answers
B3 Quartiles Worksheet
Cumulative Frequency Diagrams - Box plots from graph
Original link
Box plot values straight from the table. UNIFORM distribution used for Median, Q1 and Q3
Original link
6 Box Plots Worksheet
6 Box Plots Worksheet Answers